


The Fulcrum strives to approach news stories with an open mind and skepticism, striving to present our readers with a broad spectrum of viewpoints through diligent research and critical thinking. As best we can, remove personal bias from our reporting and seek a variety of perspectives in both our news gathering and selection of opinion pieces. However, before our readers can analyze varying viewpoints, they must have the facts.
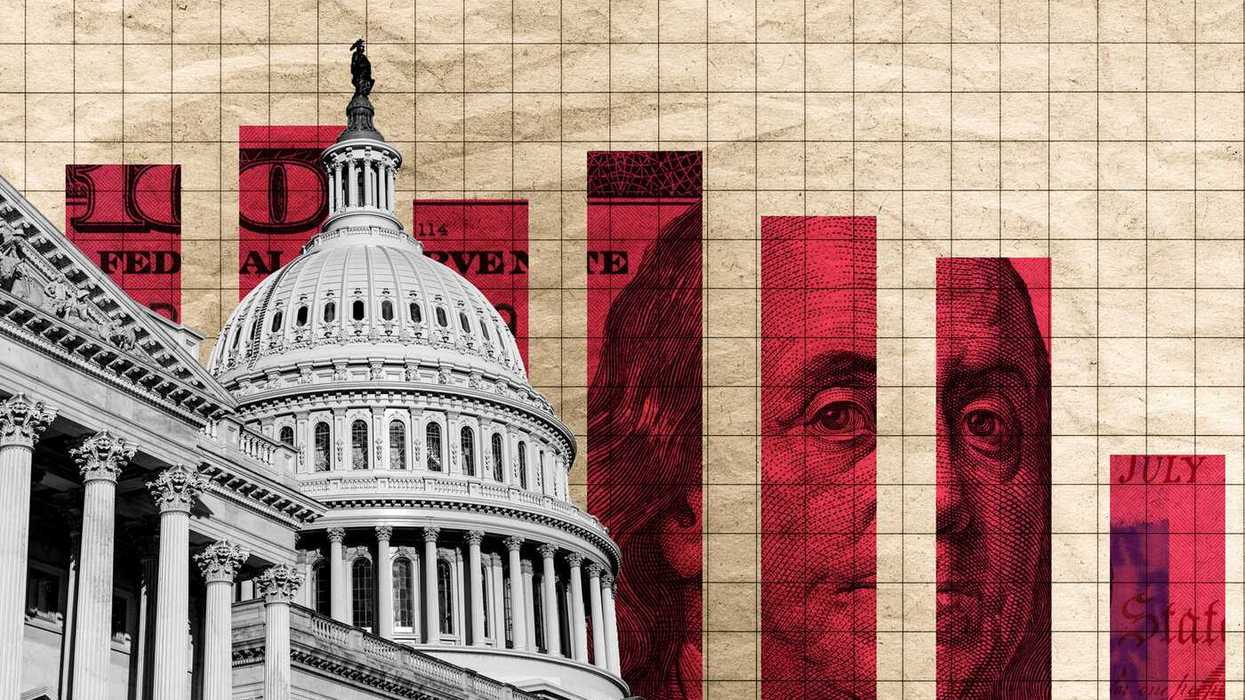
The size of the United States deficit and the potential dangers to the United States economy is widely debated in Congress. This writing presents our readers with just the facts on the deficit.
All data and information were obtained from Copilot, an AI-powered chatbot owned and operated by Microsoft Corporation.
What was the total United States deficit in 2024 and what is 1% of that in dollars?
The total U.S. federal budget deficit for the 2024 fiscal year was $1.83 trillion. Thus, 1% of 1.83 trillion is 18.3 billion dollars and one-tenth of 1% is 18 Billion dollars.
What percent of the U.S. deficit accounts for entitlement programs?
In the 2024 fiscal year, entitlement programs such as Social Security, Medicare, and Medicaid accounted for about 50% of the total federal budget. This means that roughly half of the federal spending was dedicated to these major entitlement programs.
What percent of the U.S. deficit is the Department of Defense?
Defense-related spending accounts for a significant portion of the U.S. federal budget. In the 2024 fiscal year, defense spending was approximately 13.3% of the entire federal budget. However, when considering the U.S. deficit, defense spending is a major contributor but not the largest portion, compared to entitlement programs like Social Security, Medicare, and Medicaid.
Thus, entitlements and defense added together account for roughly 63% of the total federal budget.
What percent of the U.S. deficit is Foreign Aid?
Foreign aid represents a very small portion of the U.S. federal budget. In the 2023 fiscal year, foreign aid was about 1.2% of the total federal budget. When considering the U.S. deficit, foreign aid is an even smaller fraction.
What percent of the U.S. deficit is Veteran Benefits and Services?
Veterans' benefits and services account for approximately 4.7% of the total federal budget.
What percent of the U.S. deficit is net interest payments?
Net interest payments on the U.S. national debt are a significant portion of the federal budget. In 2023, net interest payments totaled $658 billion, which was about 2.4% of the U.S. GDP. For the fiscal year 2024, interest payments reached roughly $1.2 trillion, making it the third-largest spending category behind Social Security and Medicare. Every 1% increase in the interest rate paid on the deficit increases the deficit by roughly 120 billion dollars.
How does the U.S. deficit compare as a percentage of GDP now versus the last 20 years?
The U.S. federal budget deficit as a percentage of GDP has fluctuated over the past 20 years. Here's a brief overview:
- Early 2000s: The deficit was relatively low, around 2-3% of GDP.
- 2008-2009: The deficit spiked due to the financial crisis and stimulus spending, reaching around 10% of GDP.
- 2010s: The deficit gradually decreased as the economy recovered, hovering around 4-5% of GDP.
- 2020-2021: The COVID-19 pandemic caused another spike, with the deficit reaching around 15% of GDP due to emergency spending and economic relief measures.
- 2022-2023: The deficit began to decrease again but remained higher than pre-pandemic levels, around 6-7% of GDP.
- 2024: The deficit is projected to be around 6.2% of GDP.
Comparing the current deficit to the last 20 years, it's clear that the pandemic had a significant impact, causing a sharp increase in the deficit. However, recent projections indicate that the deficit is expected to remain relatively high compared to the historical average.
How does the U.S. deficit as a percentage of GDP compare to other European nations, Russia, and China?
The U.S. deficit as a percentage of GDP is currently around 6.28%. This means the U.S. government is spending more than it earns.
Comparatively, here's how some other nations stack up to European nations and to Russia and China:
- European Union: 3.5%
- Italy: 7.4%
- France: 5.6%
- Spain: 4.8%
- Russia: 1.4%
- China: 3.9%
Who holds our debt?
As of the end of 2023, about 70% of the U.S. national debt is held by domestic entities, which include American individuals, institutions, and the Federal Reserve.
The remaining 30% is held by foreign governments and investors. The top three foreign creditors are:
- Japan: Holds about 15% of the U.S. debt.
- China: Holds about 5% of the U.S. debt.
- Other foreign investors: Including countries like Ireland, Luxembourg, and Belgium, collectively hold about 4% of the U.S. debt.
How much would be cut from the deficit if the tax rate for the top 50% of wage earners went up by 5%?
To estimate how much would be cut from the deficit if the tax rate for the top 50% of wage earners went up by 5%, we need to consider a few factors:
- Current Deficit: The U.S. deficit for the fiscal year 2024 was approximately $1.83 trillion.
- Current Tax Rate: The top 50% of wage earners are currently taxed at an average rate of 14.9%.
- Revenue Increase: A 5% increase in the tax rate would mean the new tax rate would be 19.9%.
Assuming the top 50% of wage earners contribute nearly 98% of federal income taxes, we can estimate the additional revenue generated:
- Current Revenue: Let's assume the top 50% of wage earners currently contribute $2.2 trillion in taxes (based on IRS data).
- Additional Revenue: A 5% increase of $2.2 trillion would generate $110 billion in additional revenue.
So, increasing the tax rate for the top 50% of wage earners by 5% could potentially reduce the deficit by $110 billion annually or only .32% of the total annual debt.
SUGGESTION:
Just the Facts: Trade Deficits
Just the Facts: DEI
David Nevins is co-publisher of The Fulcrum and co-founder and board chairman of the Bridge Alliance Education Fund.