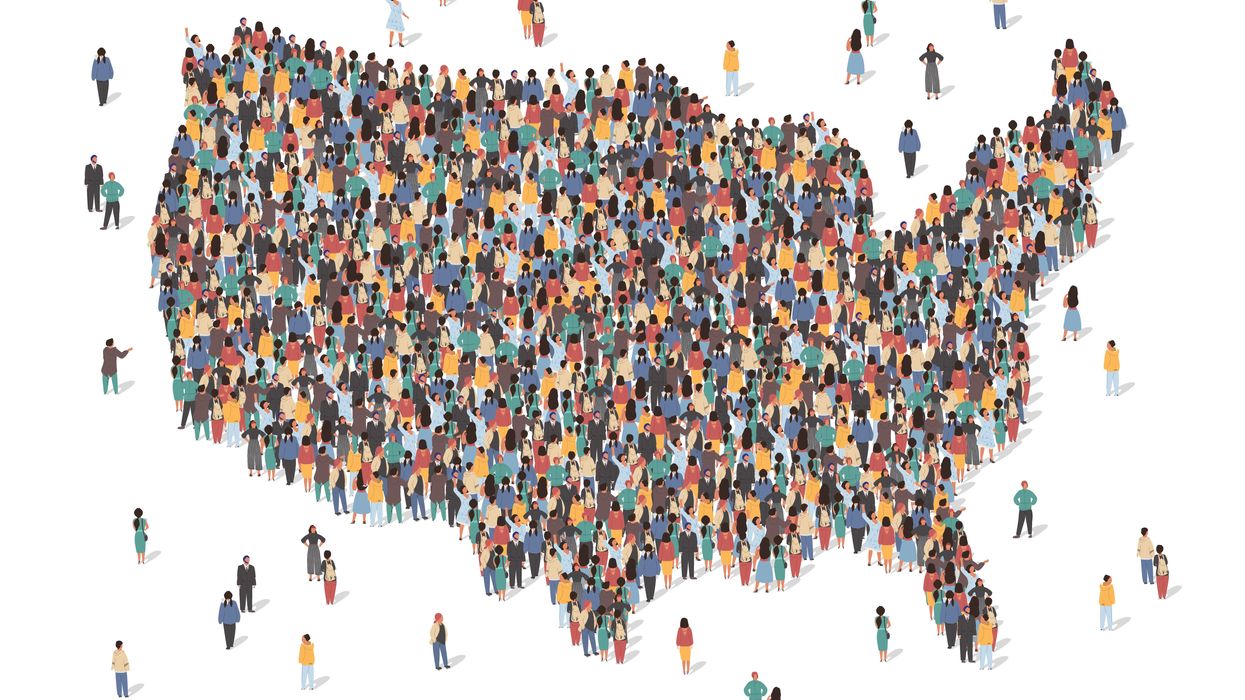
There are some notable disparities between the share of Americans considered reliable voters and the actual demographic makeup of the country.
The people most likely to turn up at the polls every election are generally older, richer, whiter and a tiny bit more female than the population on the whole. But a new analysis from the personal financial services website WalletHub reveals that the electorate in some states comes much closer than others to reflecting the gender, racial and age makeups of the places where they live.
WalletHub compared the 2016 presidential electorate in each state to its overall population to generate its Voter Representation Index. A perfect score of 100 would mean the voter demographics and the population demographics were identical. None were. But deep blue Maryland came closest, scoring a 95 — trailed closely by neighboring and almost as reliably Democratic Virginia, followed by predictably Republican Indiana and battleground Pennsylvania.
The report also analyzed how voters nationally compared to the overall population four years ago. The match was 87 percent overall, because the 2016 electorate was 2 percentage points more female (at 54 percent), 4 points more white (at 73 percent), 3 points older (24 percent had passed their 65th birthday), 7 points more married (59 percent) and 5 points more wealthy (37 percent had income above $100 ,000).
The scores of the 50 states were all bunched pretty close together, to be sure. Solidly red South Dakota has the biggest difference between its people and its voters, but still there was a 79 percent match.The 10 states with the closest correlation:
- Maryland (95)
- Virginia (94)
- Indiana (93)
- Pennsylvania (93)
- Minnesota (91)
- Oregon (91)
- Massachusetts (91)
- Nevada (91)
- Wyoming (91)
- New Jersey (90)
The 10 states with the least correlation:
- Idaho (85)
- Nebraska (85)
- Hawaii (85)
- Kentucky (85)
- Illinois (84)
- Washington (84)
- Florida (84)
- Tennessee (84)
- Kansas (82)
- South Dakota (79)
