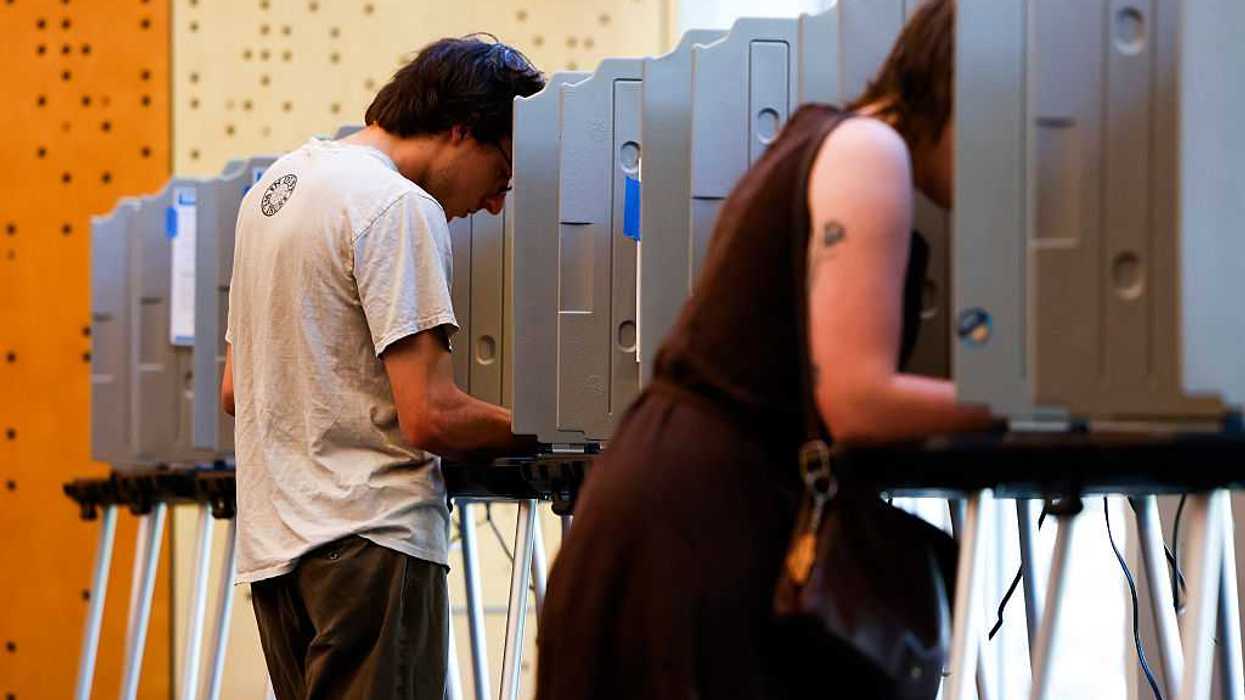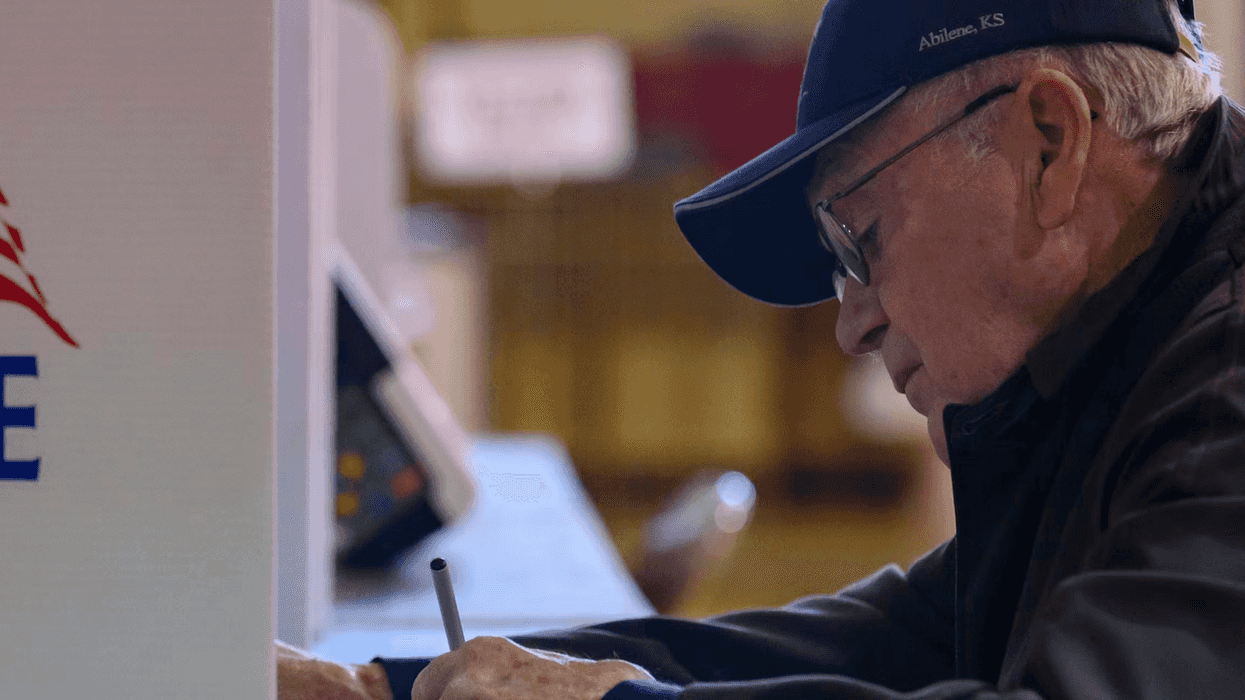


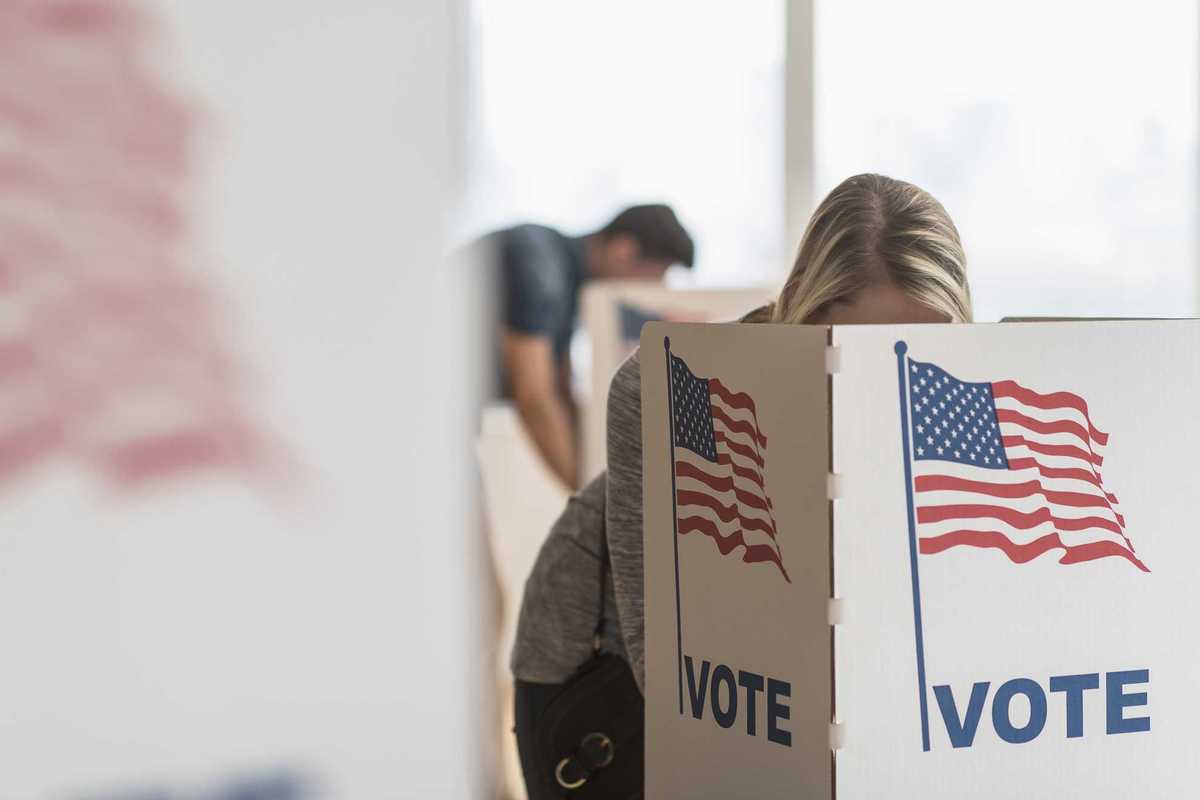


People living in African-American neighborhoods had to wait substantially longer to cast their ballots in the last presidential election than those in white neighborhoods, researchers say.
Their work joins the expanding body of evidence that members of minority groups face frequent and diverse obstacles to voting. But what makes this study particularly interesting is the high-tech way researchers reached the conclusion – by using geo-located data from cell phones.
A paper detailing the research — by M. Keith Chen and Ryne Rohla of UCLA, Kareem Haggag of Carnegie Mellon University and Devin Pope of the University of Chicago — is under review by Science magazine.
They concluded that residents of neighborhoods with entirely black populations waited 29 percent longer to vote in November 2016 than did residents of neighborhoods with all-white demographics. They also concluded that such all-African-American enclaves were 74 percent more likely than voters from totally white neighborhoods to have spend more than half an hour at their polling place.
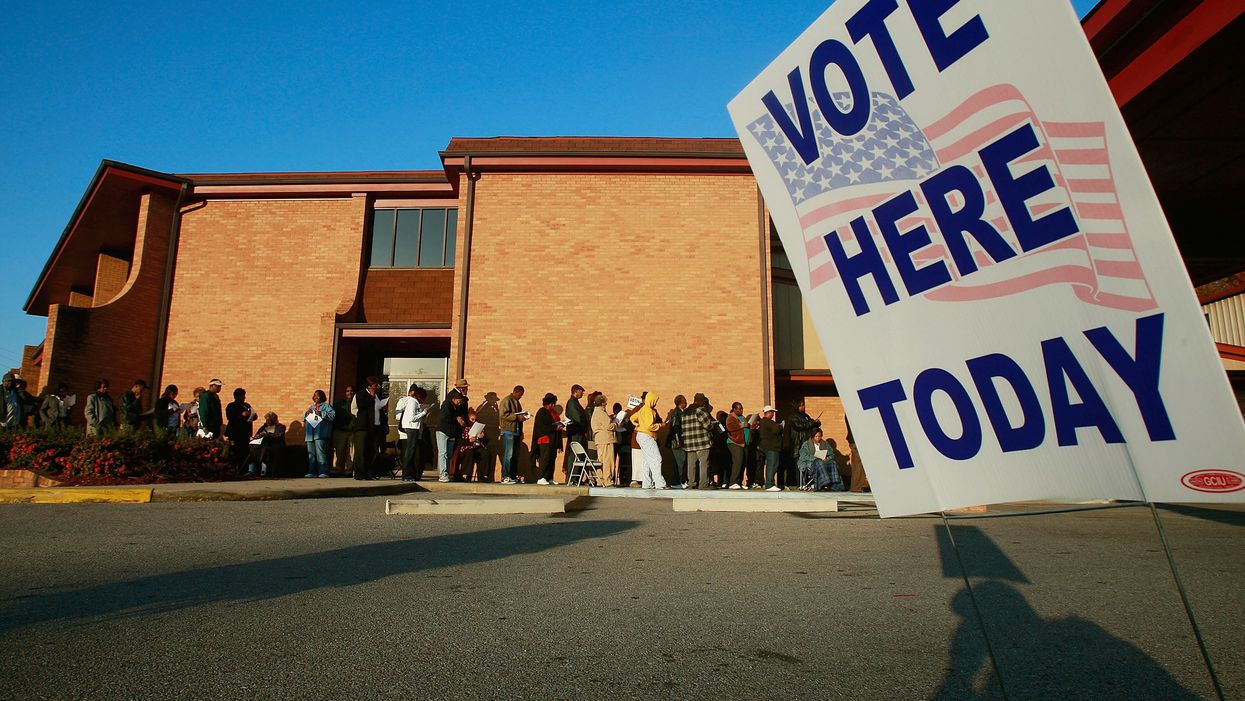
Long wait times cost the national economy more than a half billion dollars, according a separate study cited by the researchers. Also, the inconvenience of so much waiting around may prompt would-be voters to abandon the line before they get to the front – or to decide against going to their polling places at all.
This report is particularly significant because it seems to improve on previous research on long wait times, which has relied on self-reporting or the use of stop watches by researchers.
In this case, researchers obtained location data on 10 million cell phones through SafeGraph Inc., a company that mostly provides data to retailers on the travel habits of potential customers. The data, which does not identify individual cell phone owners, records where the person holding the phone is every few minutes.
This information was combined with a second dataset containing the coordinates for more than 90,000 libraries, churches, town halls, fire stations and other polling locations across the country. This was used to create "geofences" around each polling place so that researchers could track when people arrived and left the polls.
Using Census Bureau data, the researchers focused their work on relatively small areas, known as census blocks, where the populations were entirely black and entirely white.
The final sample used for the analysis was of more than 150,000 individuals identified as likely voters at more than 40,000 polling locations.
The average wait time for voters in the study was 19 minutes. Using regression analysis, researchers found that moving from a block with no black voters to one where most of the electorate is African-American added more than 5 minutes to the wait time.
Researchers conclude that their technique allows for estimating disparities in wait times and "provides policymakers an easily available and repeatable tool to both diagnose and monitor progress towards reducing such disparities."