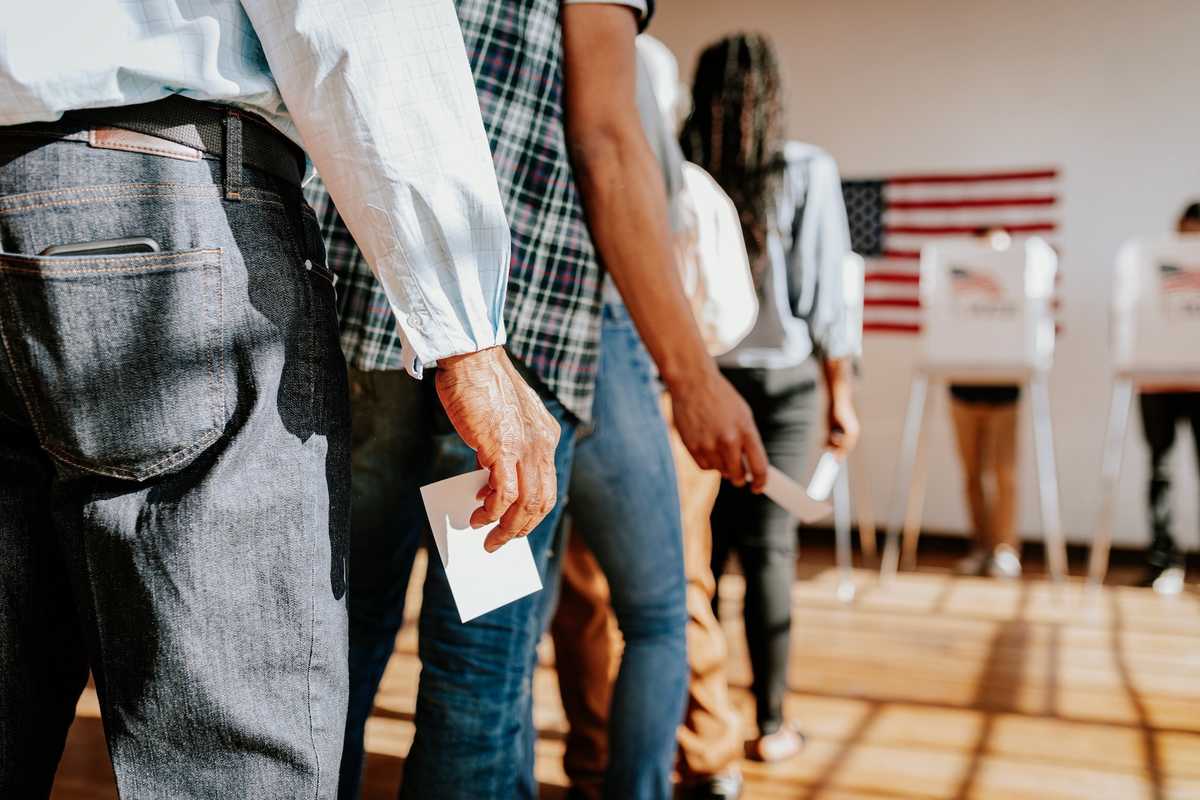
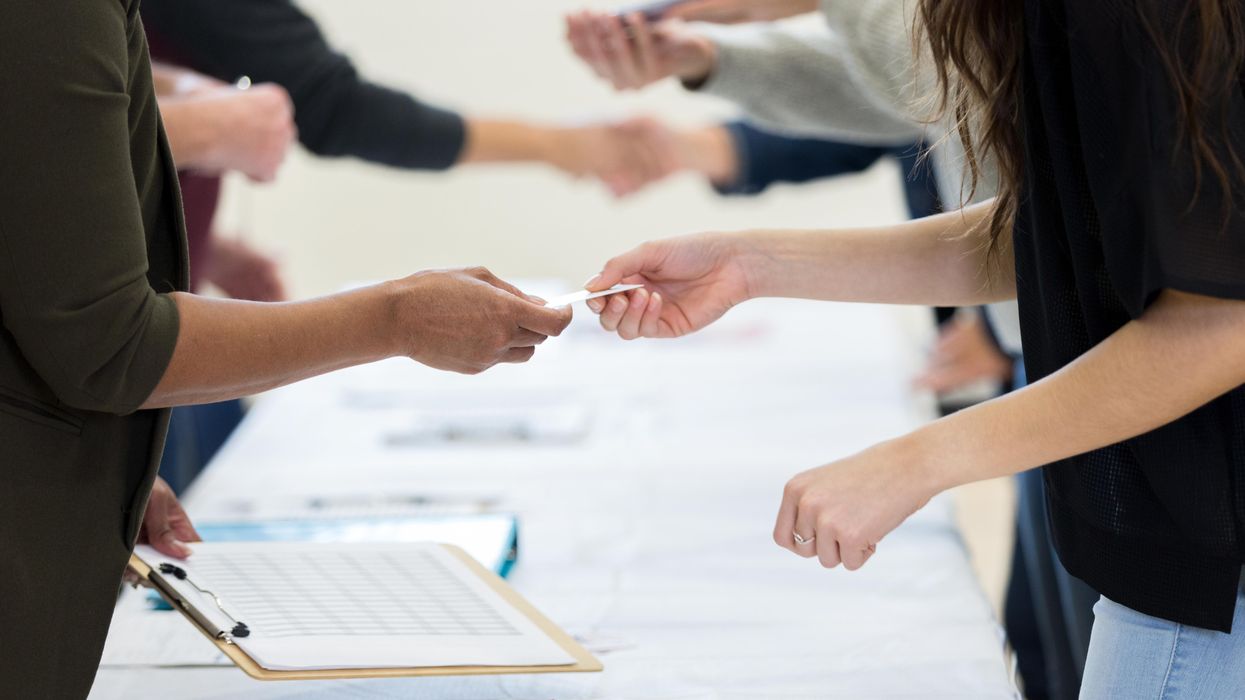
Want to cast your ballot quickly this Election Day? It will be reliably faster if you live in a predominantly white, affluent neighborhood.
That is the central finding of a nationwide study, which analyzed data provided by poll workers for last year's midterms to assess the demographic factors that most influenced wait times.
Overall, the average voter spent almost 9 minutes at the polls before casting a ballot on Election Day 2018, according to the report, issued Monday by MIT and the Bipartisan Policy Center, a prominent Washington think tank. But three demographic factors strongly influenced wait times: race, income and homeownership.
After studying voting behavior in more than 3,000 precincts across 11 states and the District of Columbia, the report found that places with large minority populations, lower household incomes and more renters experienced the longer wait times, with race being the strongest determinant.
"In precincts with 10 percent or fewer [minority] voters, the average wait time was only 5.1 minutes," BPC's Matthew Weil, an author of the study, said in a statement. "But in precincts with 90 percent or more minority voters, the average wait time climbed to an astounding 32.4 minutes."
Waiting half an hour in line was the maximum acceptable in-person wait time identified by the Presidential Commission on Election Administration, a bipartisan panel commissioned in 2013 to study and offer recommendations on best practices for administering elections.
The commission concluded that wait times to participate in the 2012 presidential election cost more than $500 million in lost wages. Other studies have found that voters facing long lines often leave their polling places without casting a ballot and then fail to show up for the next election.
The sample size of the study was only 2.7 percent of the nation's polling places, but the authors described theirs as the largest study ever of Election Day hang time. And it jives with the conclusions of other post-midterm studies on wait times experienced by minority voters.
Harvard University's Cooperative Congressional Election Study, for instance, found that African-American and Hispanic voters waited an average of 12 minutes to vote in 2018 compared to 9 minutes for white voters.
Other research conducted using geo-located cell phone data found neighborhoods with entirely black populations waited 29 percent longer to vote in the 2016 presidential election than did residents of neighborhoods with all-white demographics.
While the authors of the study did not examine the underlying causes of long wait lines, the report notes that "policy decisions in certain states cause or exacerbate many of the longest lines and have led to long lines for years."
A "misallocation of resources" needed on Election Day, mostly affecting precincts with large low-income or minority populations, was the most direct cause of the long lines, the authors note.
"In other words, there aren't enough poll books, voting booths, ballots, or machines to handle the crowd."
