


As you cross the George Washington Bridge heading west, you can smell New Jersey. You pass through notorious Superfund marshes and speed through Newark's refinery smokestacks. East Coasters love to mock this “pollution alley," but here’s the twist: starting in the 1970s, New Jersey built some of the tightest refinery regulations in the country. If that corridor still feels toxic 50 years later, what's happening in states with far fewer protections?
When federal safeguards weaken, local rules decide how clean—or how dirty—the air gets. In mid-2025, the White House granted two-year delays for certain hazardous-air-pollutant standards covering dozens of large chemical-manufacturing facilities, including one within the Phillips 66 complex in Borger, Texas. Meanwhile, its sister refinery in New Jersey must carry on under the full force of both federal and state oversight. For families living near these plants, geography now dictates protection. Nearly 845,000 residents live within ten miles of New Jersey’s Bayway refinery—barely 2,200 around Borger’s—two very different stories emanating from similar operations and riding similar winds.
New Jersey — where the rules still mean something
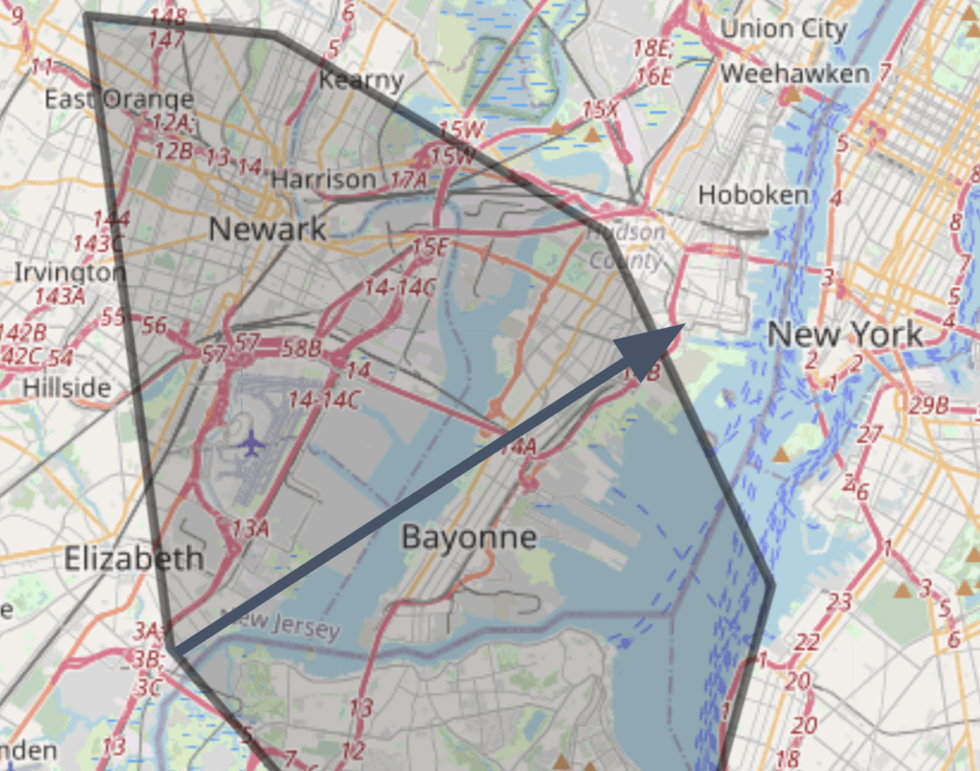
The Phillips 66 Bayway Refinery in Linden processes about a quarter-million barrels of crude oil a day, bordered by neighborhoods, schools, and tidal marshes. Winds here usually blow from west to east, carrying faint refinery smells across Elizabeth and Bayonne toward the harbor and Staten Island. Residents notice it. But New Jersey’s environmental agency doesn’t wait for complaints; it has built some of the nation’s most stringent air pollutant regulations.
EPA modeling suggests that refineries the size and type of Bayway should carry some of the nation’s highest health risks from toxic air pollutants—driven mostly by formaldehyde and benzene. Yet that’s not what the real-world health impact data show. In the ten-mile corridor east and northeast of Bayway, where the emissions typically drift, COPD prevalence averages just under 5½ percent and cancer diagnoses just above 5½ percent—both below national levels. The likely reason: New Jersey’s unusually strict permitting rules and cumulative-risk reviews, which have forced steady reductions in emissions over time. The air isn’t pristine, but it’s measured, managed, and closely watched.
Each time Bayway seeks a permit or expansion, the state runs formal risk reviews that estimate potential cancer or health effects and require air-quality modeling to check whether emissions stay below safety targets. If the numbers don’t clear the bar, tighter limits or new controls follow. These reviews sit on top of federal rules that already require continuous benzene monitoring at refinery fencelines - think of a “fenceline” as where the plant’s air meets the public’s air, and the monitors are like smoke detectors that make sure pollution isn’t sneaking out. Bayway’s recent readings have stayed below the maximum levels, and state regulations go even further—folding the results into a broader look at cumulative risks (in NJ, other factors include automobile exhaust and pollutants from Newark International Airport) for nearby communities instead of treating each pollutant or permit in isolation.
Texas — where the guardrails are farther apart
A thousand miles from Linden, the Phillips 66 complex in Borger tells a similar story under looser rules. Built during the same early-20th-century oil boom as Bayway, it still anchors the skyline of this Panhandle town. The site actually includes two major operations: a refinery that handles about 150,000 barrels of crude a day and a chemical-manufacturing plant. The refinery remains covered by the federal refinery-sector standards, but the chemical unit was among roughly fifty facilities granted a two-year delay from updated federal hazardous-air-pollutant controls. For the next two years, that portion of the complex will rely primarily on Texas’s lighter-touch regulatory system.
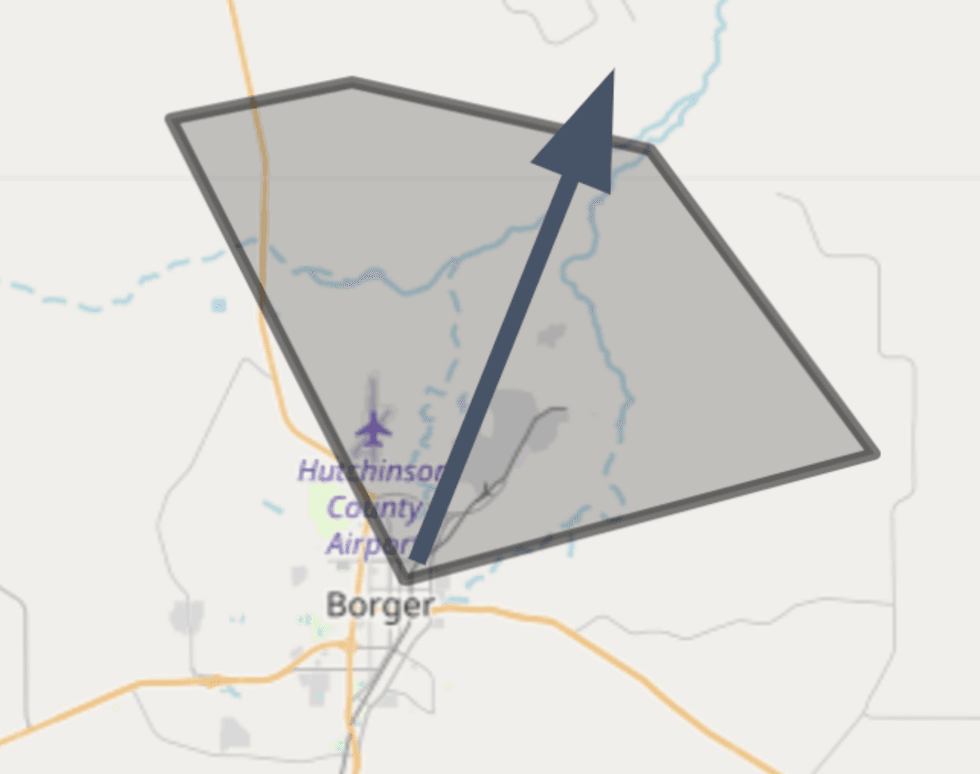
Most of the year, Borger’s winds blow from the south, carrying emissions north toward Stinnett and Lake Meredith; in winter, they swing the other way. For many residents, the wind is simply part of life. Yet for those living downwind, the air doesn’t distinguish between refinery stacks and chemical stacks—it carries whatever leaves the fence line. In the ten-mile north-northeast sector downwind of Borger, the plant’s air toxins include a similar chemical profile: formaldehyde, benzene, and 1,3-butadiene. About 2,200 residents live inside that zone, and COPD rates sit at nearly 9½ percent, with cancer prevalence near 9 percent, both above Texas and national averages, and nearly double the rates seen in New Jersey.
Texas takes a lighter approach. The state environmental agency relies on Effects Screening Levels, guideline numbers for hundreds of chemicals that help decide whether a refinery’s projected emissions look acceptable. They’re not enforceable limits—just screens. If modeled levels exceed them, regulators may ask for adjustments, but plants usually keep operating while paperwork and negotiations continue. The refinery must still follow the same federal benzene fenceline rule as Bayway, yet other hazardous-air-pollutant controls that would tighten under HON are now paused. For the next two years, Borger’s air will depend largely on state discretion, not federal guidelines—a difference that runs like the wind.
Two refineries, same logo, different playbooks
On paper, the Bayway and Borger refineries operate under the same Clean Air Act rules and corporate safety commitments. In reality, though, their oversight couldn’t be more different. New Jersey measures and manages risk before a problem becomes a crisis; Texas trusts its screening levels and self-reporting to catch issues after the fact. With the federal HON standards on hold for at least two years, those differences now decide how much protection nearby families can count on. Same company, same history, same rulebook—but two entirely different games being played—one with referees on the field, one running only on the public’s trust.
Who’s in charge?
The EPA sets the national limits for hazardous organic emissions under the Clean Air Act. New Jersey’s Department of Environmental Protection goes further, layering its own risk thresholds and community reviews on top of those federal rules. Texas, by contrast, relies mainly on guideline numbers and industry self-reporting, stepping in only when those screens are exceeded. The result is a patchwork of protection that mirrors America’s political geography more than its science.
Rule Type | Federal EPA | New Jersey DEP | Texas TCEQ |
Toxic emission threshold (benzene example) | 9 µg/m³ annual average — triggers investigation | 3–5 µg/m³ cumulative risk target; additional controls often required | ~30 µg/m³ “effects screening level” — advisory only |
Enforceability | Legally binding | Legally binding and often stricter | Primarily advisory, rarely results in shutdowns |
Compliance Monitoring | Fenceline sampling every 2 weeks | Continuous and integrated with community risk modeling | Periodic self-reporting; limited spot check |
Public Transparency | Required online disclosure | Full public posting and comment for each permit | Summary data only; technical files by request |
Regulatory Posture | Set national floor | Tighten limits proactively | Relax limits pending “screening” |
Current status (chemical plant rules) | Updated standards delayed for 2 years at selected sites | Still enforced | Delayed through 2027 for Borger’s chemical unit |
When federal protections pause, the air doesn’t. Pipes keep venting, wind keeps blowing, and communities keep breathing what comes their way. The real test will arrive not when rules restart, but when we measure what changed in their absence. New Jersey’s families will have spent those years under dual oversight. Borger’s will have spent them trusting that guidance levels and good intentions were enough. The question is not whether companies can meet the same standard, but whether the country still expects them to. Pollution and fairness drift on the same wind—and when safeguards go quiet, the air doesn’t wait. Neither should we.
—----------------------------------------------------------
Methods (summary)
For each refinery, I defined a 10-mile downwind sector based on prevailing winds (Bayway: ENE; Borger: NNE–ENE). I mapped a sector cone (±45–75° as needed to reflect seasonal shifts) and identified census tracts/ZCTAs whose centroids fall inside the cone.
 Google Maps
 Google Maps
Note that the prevailing wind in Linden is much more widespread seasonally than it is in Borger. Let me know if you’d like me to send specs to an artist, or if you’d like, you can certainly include these layers I built on top of Google maps.
I then:
- Pulled air toxics context (AirToxScreen: dominant pollutants, modeled cancer risk) for the cone.
- Selected four communities per site: in the cone, out to 10 miles.
- Collected health indicators: COPD (age-adjusted %) from CDC PLACES; cancer (age-adjusted incidence per 100k) from state registries/USCS, using multi-year averages when tract/ZIP data were suppressed.
Brent McKenzie is a writer and educator based in the United States. He is the creator of Idiots & Charlatans, a watchdog-style website focused on democratic values and climate change. He previously taught in Brussels and has spent the majority of his professional career in educational publishing.