How do we define diversity in the United States? The census offers breakdowns by age, race, gender and other characteristics. Or we could also look at party registration and election results to measure political diversity.
But what if we could combine various factors to determine which are truly the most and least diverse states in the country? We can now, because the number-crunchers at WalletHub developed an algorithm and ranking of their own.
And the results show both red and blue states spread throughout the list, because political diversity is one of the factors included in the calculations.
“When most people hear the word “diversity”, they think of race/ethnicity. However, many types of diversity include socioeconomic status (e.g., education, income, and occupation), religion, political ideology, household size, immigrant status, language, and geography. States are also diverse within them. Depending on where a person lives in a state, such as in an urban, suburban, or rural area, can dictate what they experience culturally,” said Rashawn Ray, a senior fellow at the Brookings Institution.
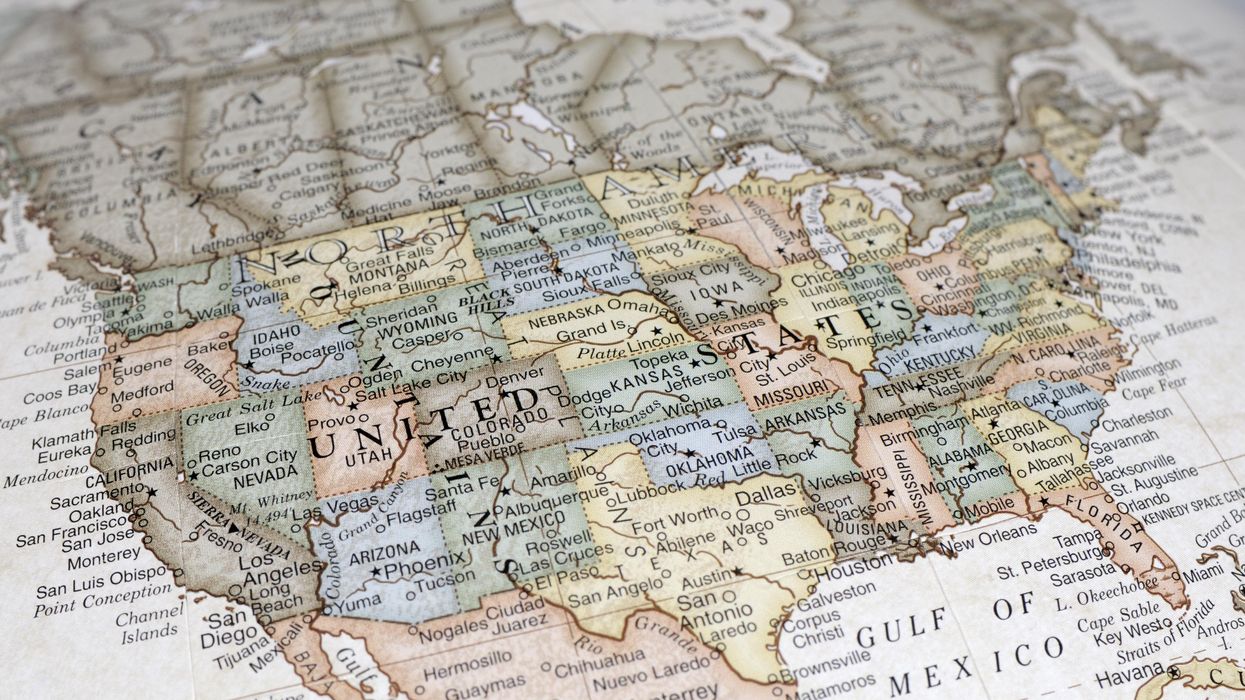
Every state was scored in six categories of diversity: socio-economic, cultural, economic, household, religious and political. The highest score went to liberal California, which was followed closely by conservative Texas.
The Golden State ranked first in both socio-economic and cultural diversity. While Texas didn’t lead in any categories, it was fourth in cultural diversity, sixth in religious diversity and ninth in socio-economic diversity.
The rest of the top 10 is dominated by states from the East Coast and Southwest: Hawaii, New Jersey, New York, New Mexico, Florida, Maryland, Nevada and Arizona.
“Living in a diverse environment makes it easier to see that even if there are differences, most of us share similar goals and priorities like keeping our families healthy and safe, educating our kids in a supportive environment, and earning a good living,” said Andrew Burnstine, an associate professor in Lynn University’s College of Business and Management.
The 10 least diverse states, according to WalletHub, are (from 41 to 50): Iowa, Ohio, Utah, Wyoming, Kentucky, Montana, New Hampshire, Vermont, Maine and West Virginia.
West Virginia ranks last in both the socio-economic and cultural diversity categories, and in the bottom 10 in religious and political diversity.
Government should take advantage of the nation’s diversity, according to researchers and academics consulted by WalletHub.
“The United States could highlight the achievements of diverse individuals and groups. States could also make data-driven decisions about which groups may need additional support to thrive and in what ways,” said Lori Martin, a professor of African and African American Studies, humanities and social sciences at Louisiana State University. “This may include supporting under-resourced schools and black-owned businesses. States must demonstrate a commitment to equity, which is not the same as equality.”
WalletHub broke the six categories down into 14 data points, including household income, education, race, birthplace, occupations, marital status, age, religion and political affiliation.
States were also ranked within those subcategories. Among them:
- Income: Utah was at the most diverse; Mississippi was the least.
- Educational attainment: Massachusetts; West Virginia.
- Race and ethnicity: Hawaii; Maine.
- Language: California; West Virginia.
- Birthplace: Nevada; Louisiana.
- Industry: Texas; Massachusetts.
- Occupation: Mississippi; Massachusetts.
- Worker class: Alaska; Indiana.
- Marital status: Mississippi; Utah.
- Generations: Florida; Utah.
- Household type: New Mexico;
- Household size: Utah; West Virginia.
