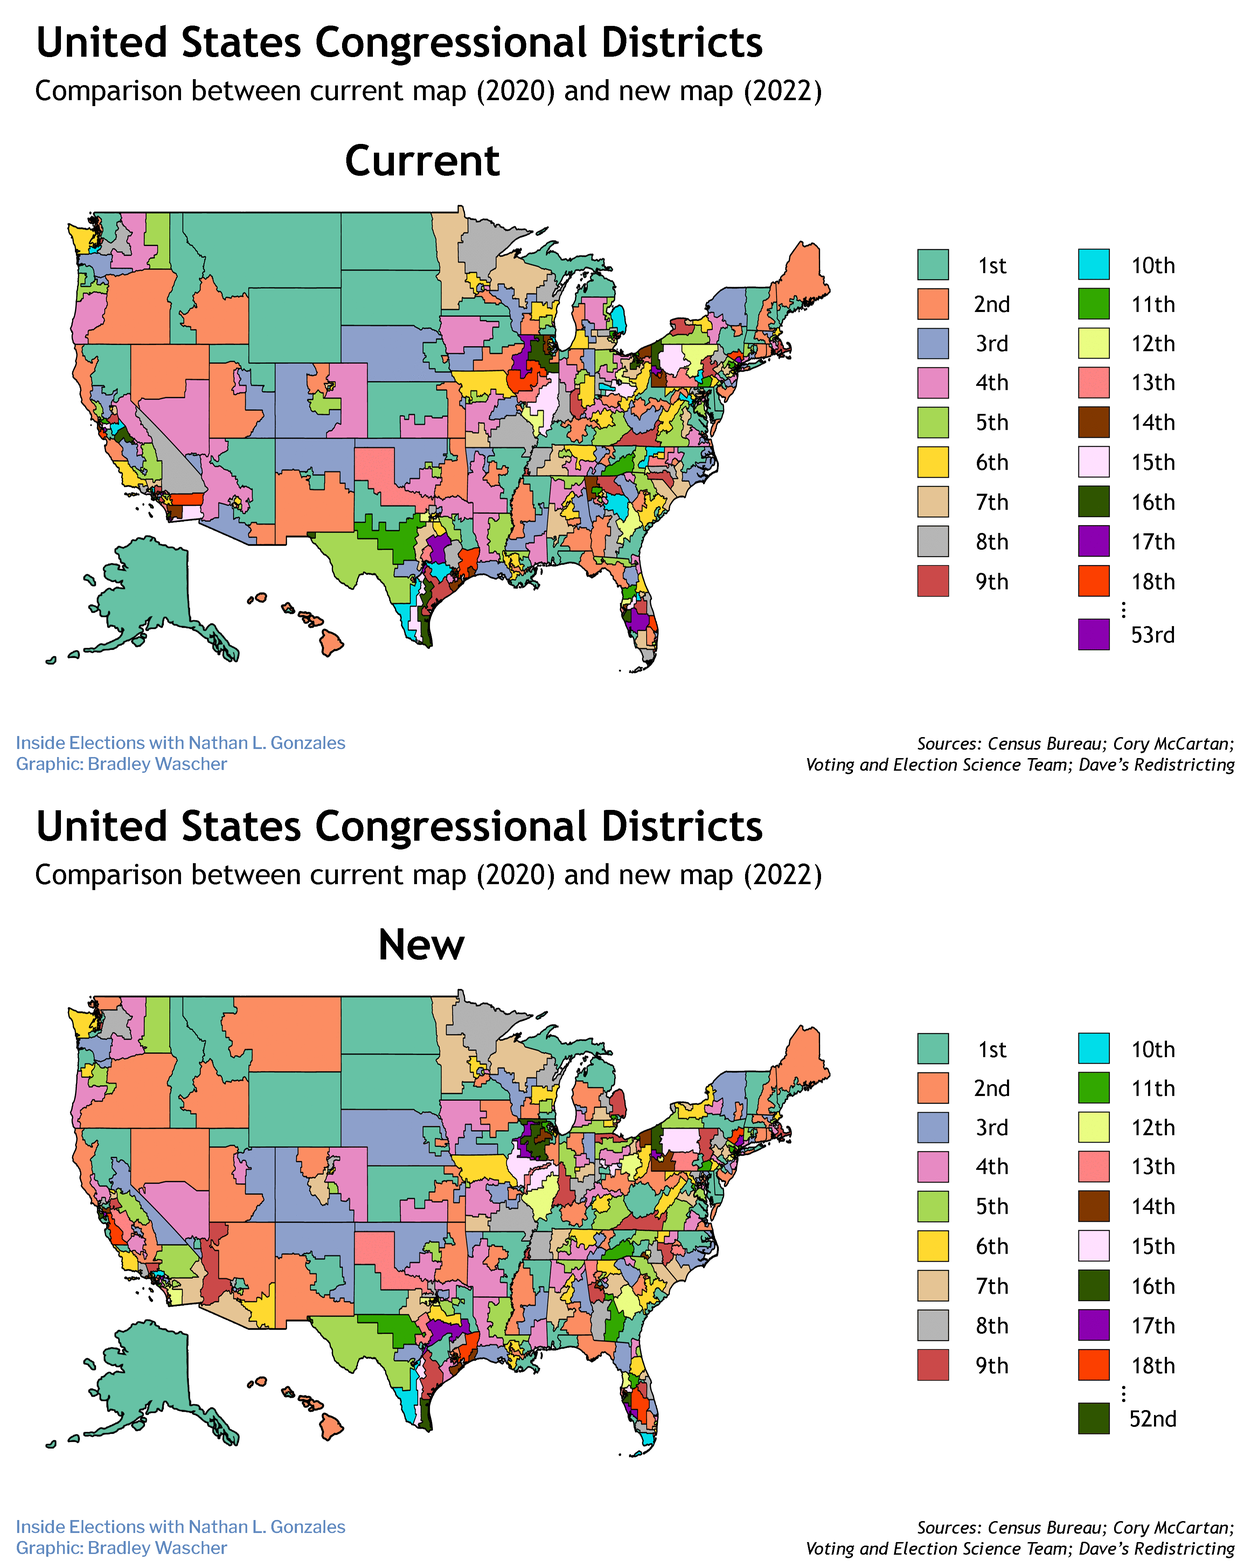
We have come to expect that certain states, in fact certain regions of the country, are permanently controlled by one party. Republicans in the South and Plains. Democrats on the West Coast and in the Northeast. But a review of historic redistricting data shows how control has shifted over the past five decades.
The Campaign Legal Center scored 50 years’ worth of congressional and state legislative district maps for partisan bias in the decennial redistricting process. And the results show some remarkable changes.
For example, the congressional maps for Indiana, Michigan and Wisconsin have skewed heavily toward the Republicans since the post-2000 round of redistricting. But a review of maps dating back to 1972 shows that for many years those states’ plans actually favored the Democrats.
Likewise, in 1972, California had a slight lean toward Republicans but in the ensuing decades had been equally balanced until shifting toward the Democratic column in 2012. And the Texas maps favored Democrats for three decades before shifting right in 2012.
The CLC’s scoring found that while partisan gerrymandering continues to be a concern in many states, bias has not grown more severe in the latest cycle. In fact, CLC found that four Republican-dominated states – Florida, North Carolina, Pennsylvania and Virginia – shifted more toward balanced maps, with zero states on either side becoming more extreme.
Among the 43 states that have at least two representatives in the U.S. House, more than half (24) demonstrate some level of bias in their 2022 maps.
A number of factors impacted the redistricting process in unprecedented ways this cycle, explained Mark Gaber, senior director of redistricting for CLC.
“On the legal front, there’s two main decisions from the U.S. Supreme Court that had outsized influence on how this redistricting process unfolded,” he said.
The court’s ruling in the 2013 case Shelby County v. Holder tossed out the Voting Rights Act’s “preclearance” provision, which required states with a history of voting rights violations to get federal approval before changing election laws. And in 2019, the court ruled in Rucho v. Common Cause that federal courts have no standing to weigh in on partisan gerrymandering.
Other factors also impacted the process.
“One obvious one is Covid. That delayed the release of the census data and really truncated the process for redistricting, which is not great for public participation and transparency,” Gaber said “But on a more political level, there were more states that had split control of government, so there were fewer opportunities … for one-party control to dictate the outcome. And the other is the development and existence of independent redistricting commissions and other forms of bipartisan commission.”
According to the National Conference of State Legislatures, 10 states use redistricting commissions to draw congressional lines, but even those are not without bias. The new maps in Arizona, California, Michigan, New Jersey and Washington all slightly favor Democrats. The 2022 redistricting process in Colorado and Virginia favored the GOP. (No data was available for the new maps in Hawaii, Idaho and Montana.)
“There were more states with split control or Democratic control, I think, than in 2010 but nevertheless Republicans continued to control the process in more states,” said Chris Warshaw, an associate professor of political science at George Washington University.
The redistricting maps favor Republicans in 16 states, according to CLC’s data, whereas 11 states’ maps are skewed to the left. But those numbers have swung dramatically over the past 50 years.
In 1992, each party benefited from 10 maps. But in 1972, 13 maps were biased for Democrats, compared to just seven for Republicans.
The Campaign Legal Center’s PlanScore system grades maps on four criteria:
- Efficiency gap, or cracking and packing a party’s supporters to undervalue certain people’s votes.
- Partisan bias, which measures the difference between a party’s seat share and hypothetical tied election.
- The difference between a party’s median vote share and its mean vote share.
- Declination, which identifies partisan gerrymandering based on designed win/loss outcomes.


