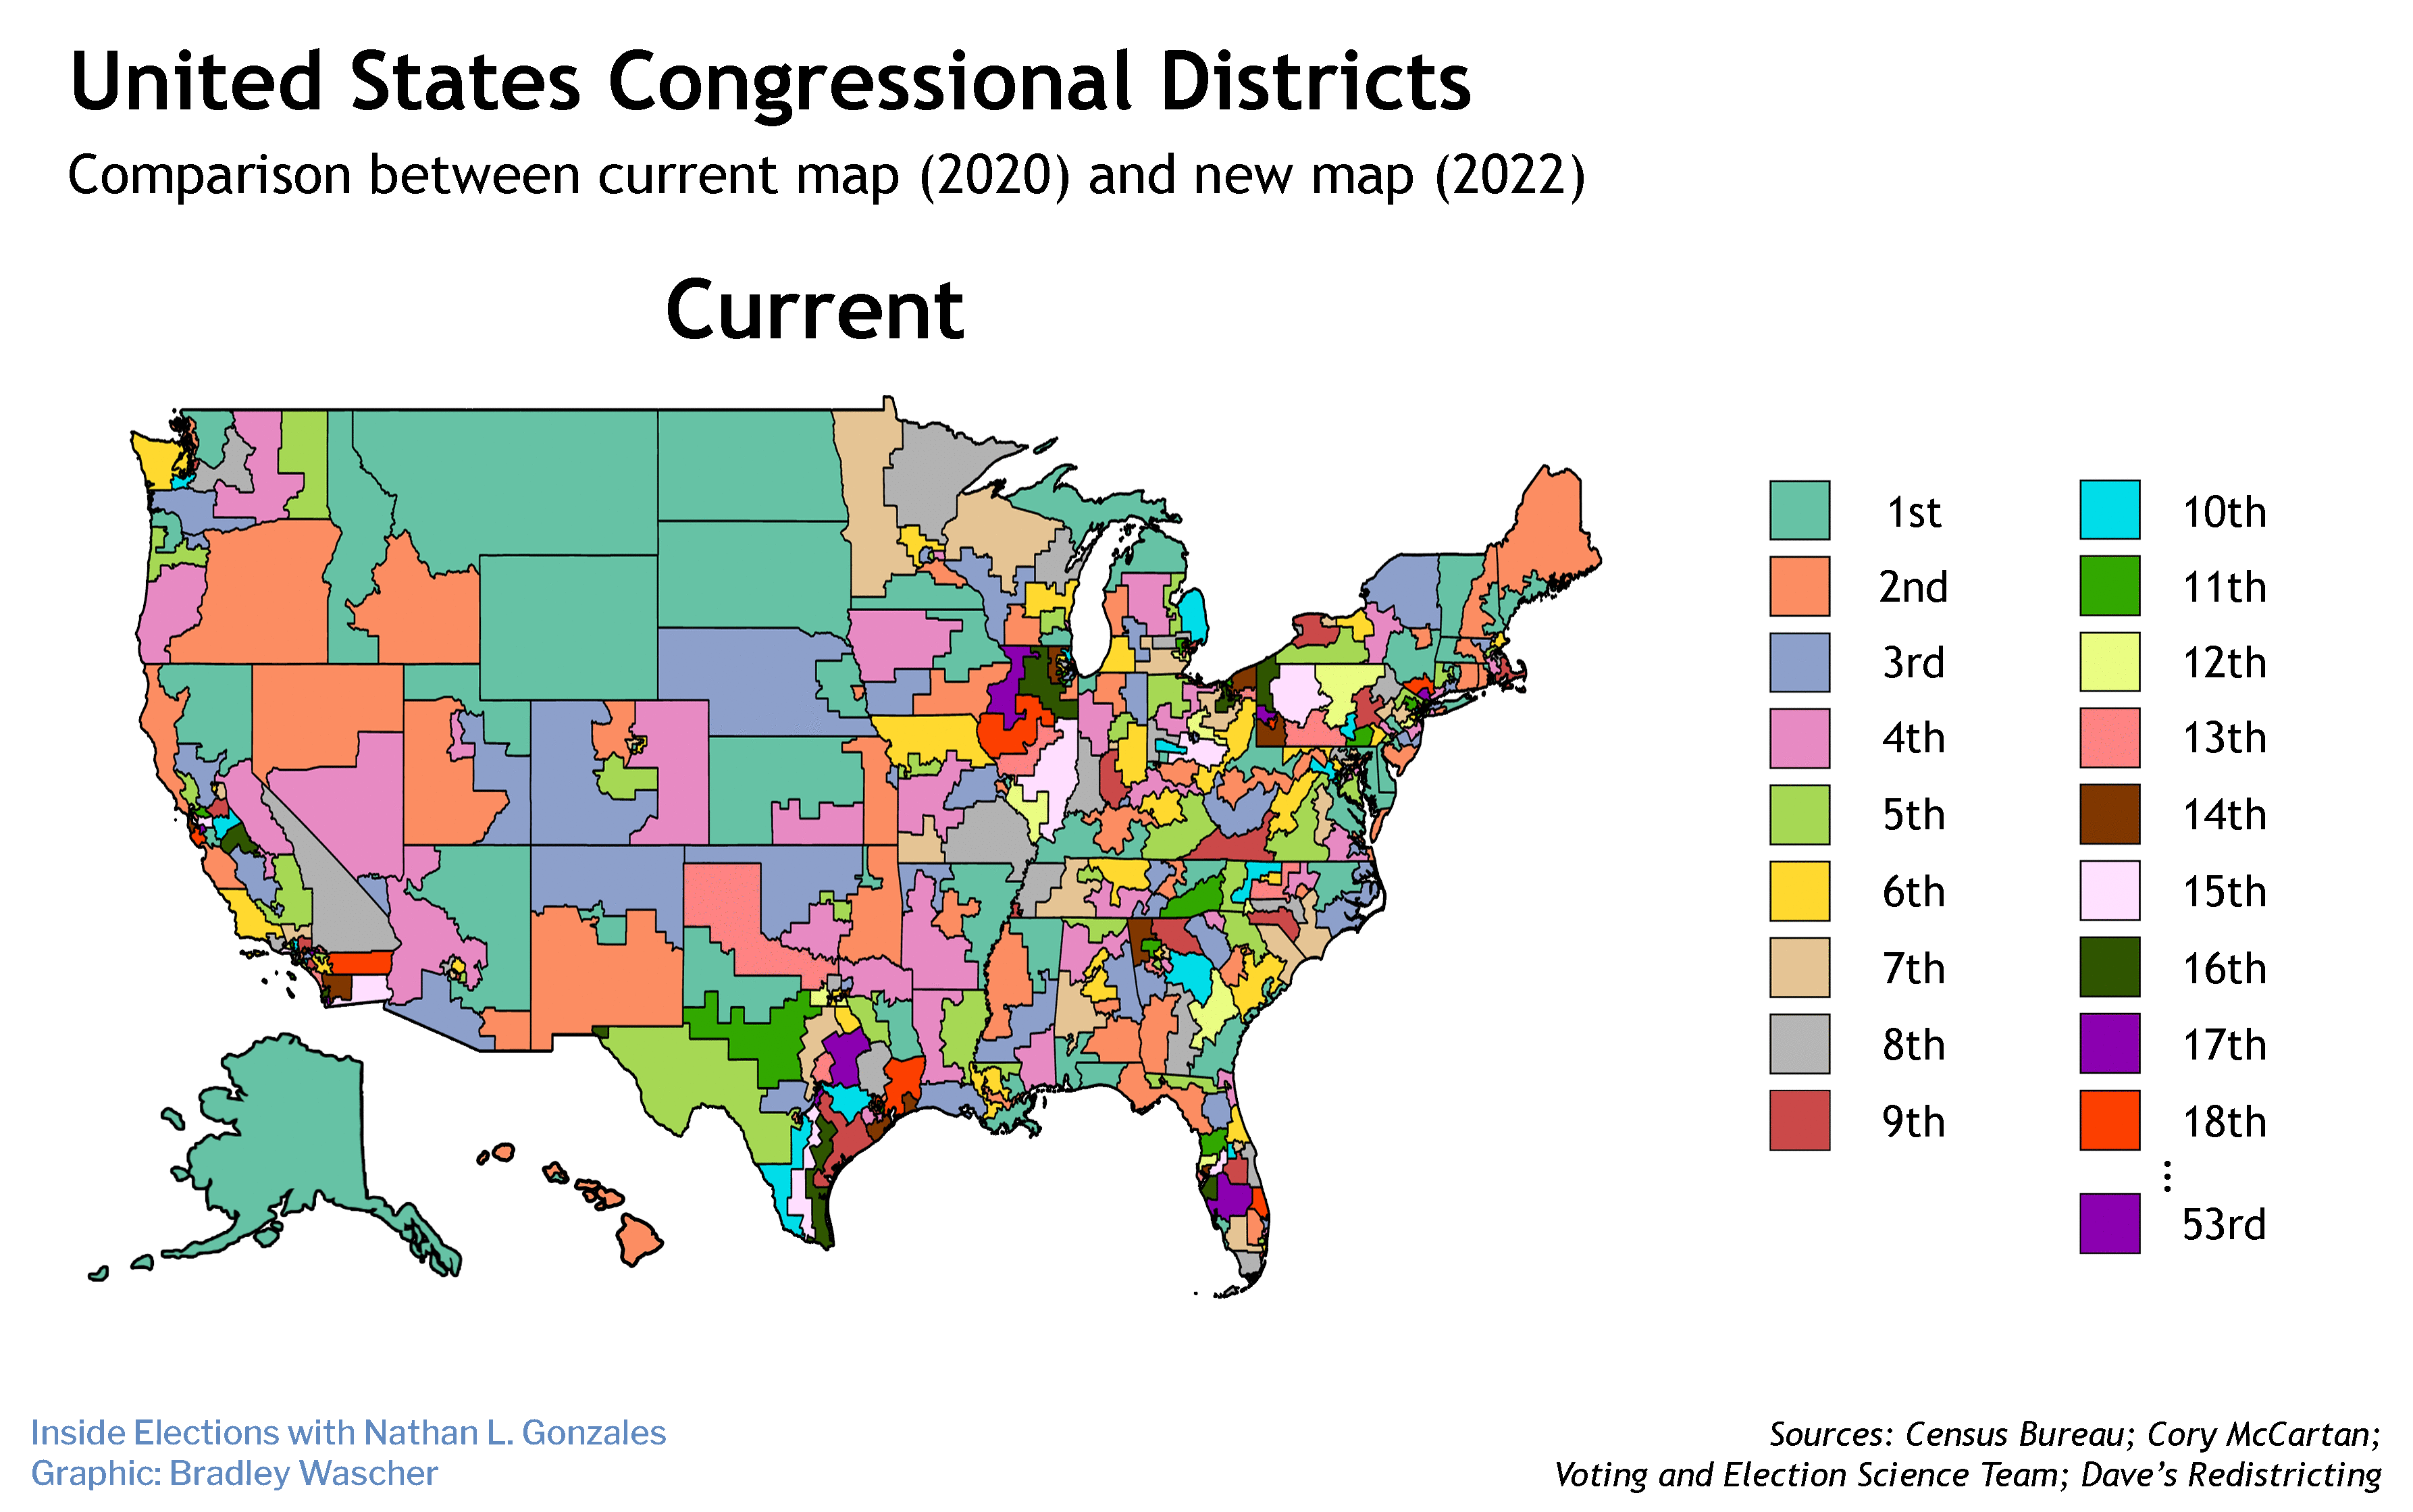


With two post-census election cycles in the books, congressional district maps are mostly set for the remainder of the decade – which means we will know the outcomes of the vast majority of House elections before voters even cast ballots in November 2026, 2028 and 2030.
That’s because most states allow politicians to draw district maps, enabling them to use voter data to create maps that favor the party that controls the legislature. Both parties use practices like “cracking” and “packing” to divide minority-party communities across multiple districts or combine them into as few districts as possible, all to guarantee control in future elections.
This practice is known as gerrymandering, and when practiced for partisan purposes it is legal, according to the Supreme Court.
Five years ago, we asked a number of redistricting experts to identify the worst examples of gerrymandering. But since states have since drawn new districts, it’s time to revisit the maps and see which ones stand out — for all the wrong reasons — this decade.
This list was created by aggregating input from:
- David Daley, senior fellow at FairVote and author of “ Ratf**ked: Why Your Vote Doesn’t Count.”
- Mark Gaber, senior director of redistricting at the Campaign Legal Center.
- Nicholas Seabrook, chair of the department of political science and public administration at the University of North Florida and author of “ One Person, One Vote: A Surprising History of Gerrymandering in America.”
- Emma Shoucair, an anti-gerrymandering expert with RepresentUs.
- Sam Wang, director of the Electoral Innovation Lab.
While there were no unanimous picks among the five experts, many districts were identified by multiple participants as the worst examples of gerrymandering. We have ranked the top (bottom?) 12 based on the number of mentions, with our own judgement serving as tiebreakers in some cases.
According to Shoucair, gerrymandering was not as pervasive this decade as in the previous round of remapping.
“The maps after the 2020-2022 redistricting cycle are overall much better than those after the 2010-2012 cycle,” she said. “This is a result of a few dynamics: Some states passed redistricting reforms, including independent redistricting commissions; some states elected divided governments, which resulted in compromise and fairer maps. We also don't see as many egregiously shaped districts ... as in prior redistricting cycles. A common dynamic we do see, though, is a reduction in overall competitiveness of lots of state maps.”
Wang agreed that gerrymandering isn’t just about individual district designs.
“People think of gerrymanders as consisting of funny-shaped individual districts. But that’s not true,” he said. “A clever expert with mapping software can lasso voters wherever they live, and those districts sometimes even look superficially okay. Also, these days gerrymandering is not a single-district offense. Instead, the offense arises from skew in the statewide plan as a whole.”
Below we present the worst gerrymanders of the 2020s, with select (and lightly edited) explanations from the experts. If you have districts you think are missing from this list, send us your suggestions.
 MapChart
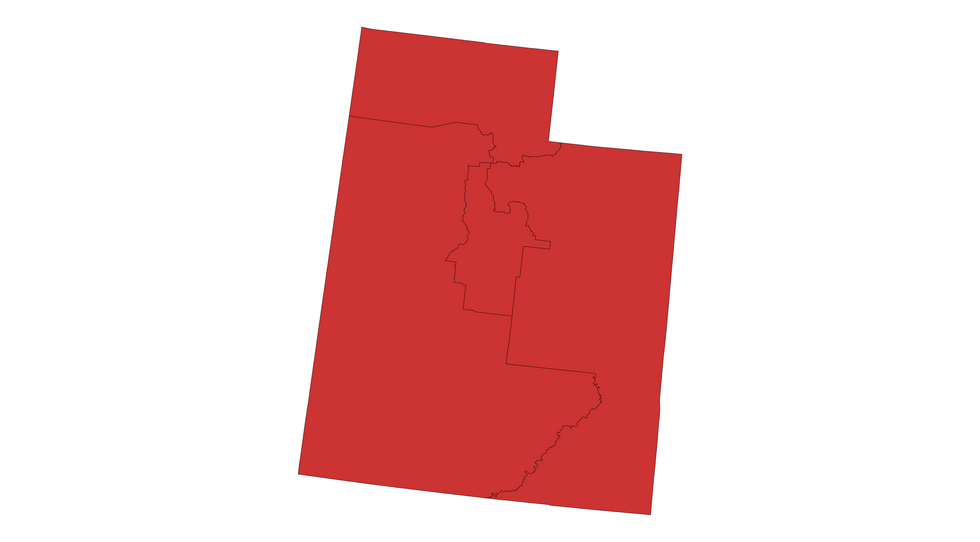
1. Salt Lake City
Daley: Utah’s largest city went for Joe Biden by double digits in 2020 and the state often elected a Democratic lawmaker to Congress. Not anymore. Lawmakers — ignoring a statewide initiative that banned partisan gerrymandering — sliced the county into four pieces, attached a section to each congressional district and ensured a 4-0 GOP delegation.
Gaber: All four of Utah’s congressional districts meet in the middle of Salt Lake County, cracking apart the Salt Lake City metropolitan area. This robs the state’s largest metropolitan area of a dedicated representative in Congress in order to ensure Republican control of all four of the state’s congressional districts. (CLC represents plaintiffs suing in Utah court challenging this map.)
Wang: Greater Salt Lake City is an island of blue in a sea of red. Traditionally, it has been enclosed within a single district, which has led Democrats to have one of Utah’s congressional seats. But this time, legislators trampled a newly established citizen commission to spread Salt Lake City across all four districts of the state. A recent state Supreme Court ruling could return power to the commission, and Salt Lake City could gain representation once again.
Seabrook: Despite a voter-approved 2018 ballot initiative that called for fair maps, the Utah Legislature commandeered the redistricting process and passed a map that split Salt Lake City between all four of the state’s U.S. House districts, each of which are currently Republican.
 MapChart
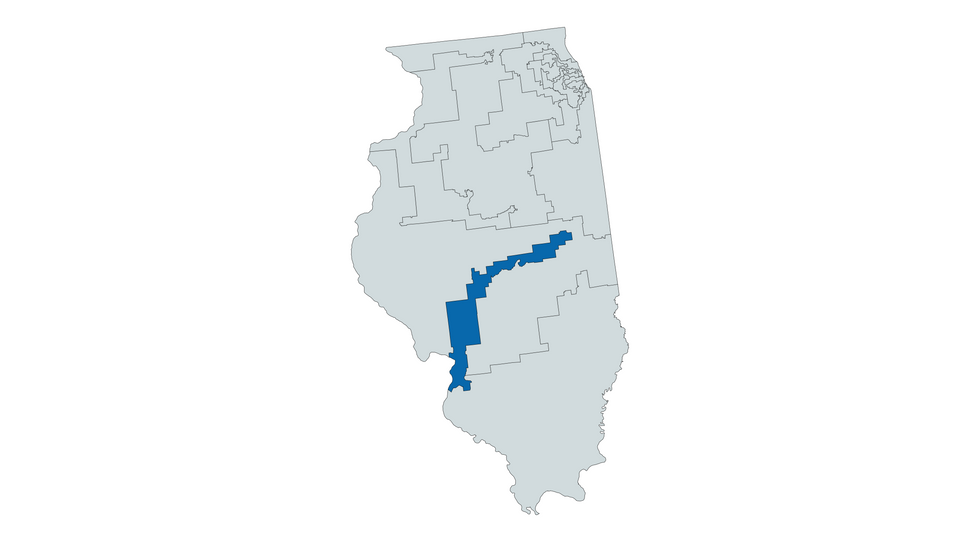
2. A narrow strip of Illinois
Seabrook: Perhaps the most egregious Democratic-drawn gerrymander on the current congressional map is in Illinois. The worst example is the 13th district, which connects disparate pockets of Democratic voters in Champaign, Urbana, Decatur, Springfield and East St. Louis. The district splits six counties, as well as multiple townships, cities and even precincts, contributing to a 14-3 Democratic edge in the state overall.
Gaber: This noncompact, narrow district is drawn to connect the Democratic suburbs of St. Louis, Springfield and the University of Illinois in Urbana-Champaign to create an unusually shaped Democratic district.
Shoucair: Illinois is the most aggressive Democratic gerrymander in the country, reducing five Republican seats to three. It did so by drawing districts such that a large number of Republican votes are "wasted," either in districts that are already overwhelmingly Republican or in districts where they are vastly outnumbered by Democratic votes.
Wang: This specimen manages to go all the way from East St. Louis to Urbana-Champaign, combining an urban community, a college town and a few strays along the way to create a safe Democratic district.
 MapChart
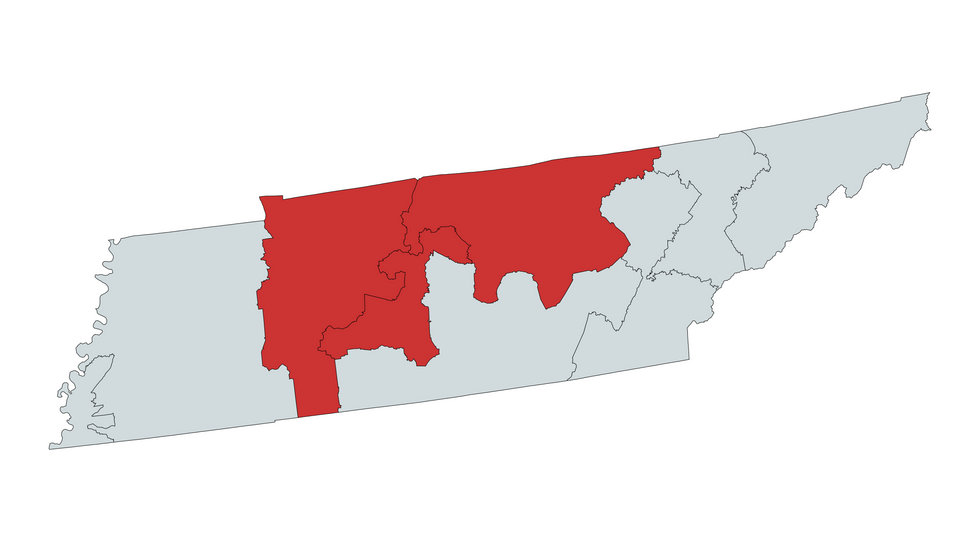
3. Nashville
Gaber: Nashville is split among three congressional districts, leaving Tennessee’s largest city with no dedicated representative in Congress and ensuring that Republicans will carry all congressional districts except Memphis’.
Wang: Nashville has been traditionally contained with a single congressional district. But Tennessee legislators split the old 5th district three ways, removing the ability of this city of nearly 700,000 people to send someone to Congress.
Seabrook: Democratic Rep. Jim Cooper had represented the city in Congress for almost 20 years, but immediately announced his retirement after his Nashville district was carved up and split between three heavily Republican surrounding seats, the 5th, 6th and 7th districts. Republicans now control all seven of Tennessee’s House seats.
Daley: Cooper easily won re-elections with upwards of 60 percent of the vote. Republicans knocked him out with one of the most brazen gerrymanders of the 2021 cycle, cracking blue Nashville and scattered it across three new bright red districts.
 MapChart
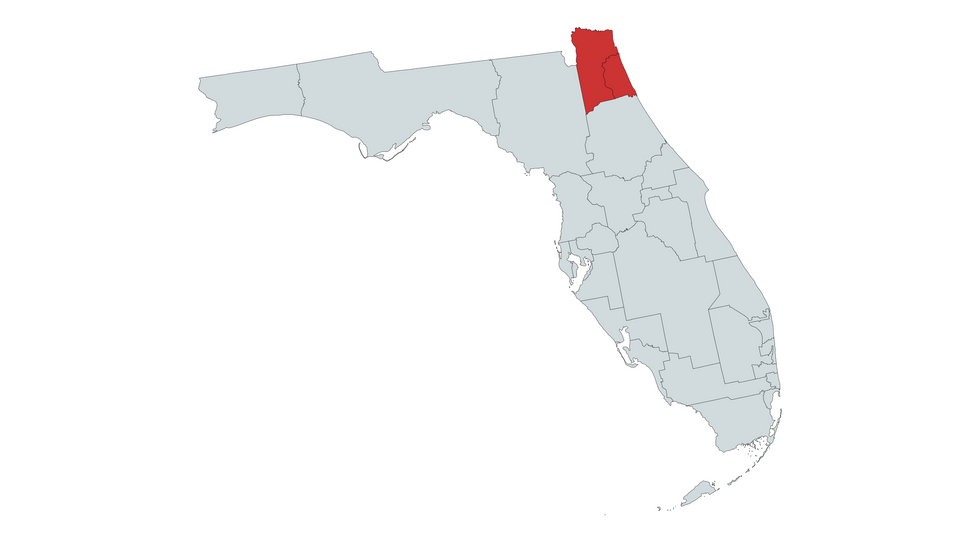
4. Jacksonville
Shoucair: Florida engaged in racial gerrymandering by eliminating a majority-Black district in northern Florida, drawing the significant Black voting age population in Tallahassee and Jacksonville in with the much redder neighboring areas to eliminate the ability of those Black voters to elect their representative of choice.
Seabrook: The city of Jacksonville, in northeast Florida, was bifurcated along the St. Johns River by Gov. Ron DeSantis’ 2022 gerrymander. One half of the city was placed in the 4th district, along with rural Nassau and Clay counties, while the other half was put into the 5th district, along with heavily Republican St. Johns County. Both districts have reliably elected Republicans to Congress, and the GOP now controls 20 of Florida’s 28 U.S. House seats.
 MapChart
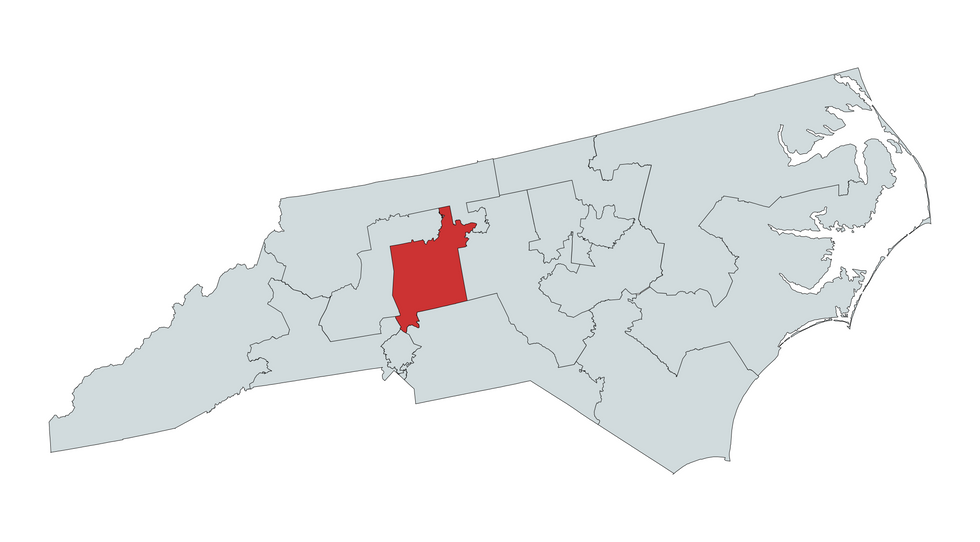
5. Court-approved cracking in North Carolina
Wang: In 2022, a state Supreme Court struck down a partisan gerrymander, putting in place a much fairer map. But the election of several Republicans to the court led that court to reverse itself in 2023. At that point the legislature promptly passed a plan that will elect at least 10 Republicans out of 14 seats in this 50-50 state. The 6th district is nestled between Winston-Salem, Greensboro and Charlotte to create a safe Republican district.
Graber: After Republicans took control of the North Carolina Supreme Court, they reversed an opinion that held partisan gerrymandering unconstitutional, and legislative Republicans then badly gerrymandered this swing state. One example is the cracking of the minority and Democratic population in Winston-Salem and Greensboro across three congressional districts.
 MapChart
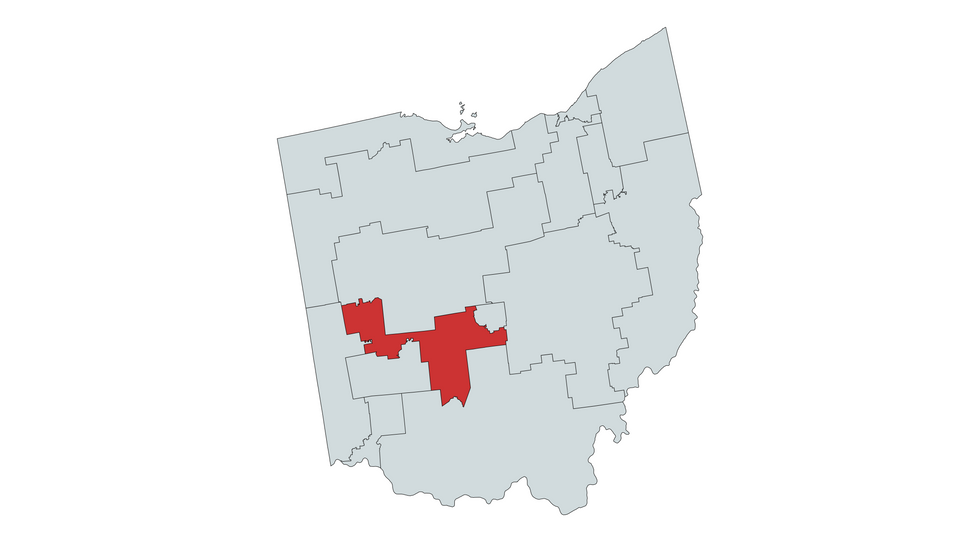
6. The efficiency gap in Ohio
Wang: A politician-based commission drew a map that could make as many as 13 out of 15 Ohio seats Republican. The 15th district tiptoes right up to Columbus in the east and dodges Springfield in the south to create a safe Republican district.
Shoucair: The current much-litigated Ohio congressional map draws Democrats into highly concentrated districts, limiting the number of districts they can influence. It’s an example of the efficiency gap and resulted in very few competitive seats.
 MapChart
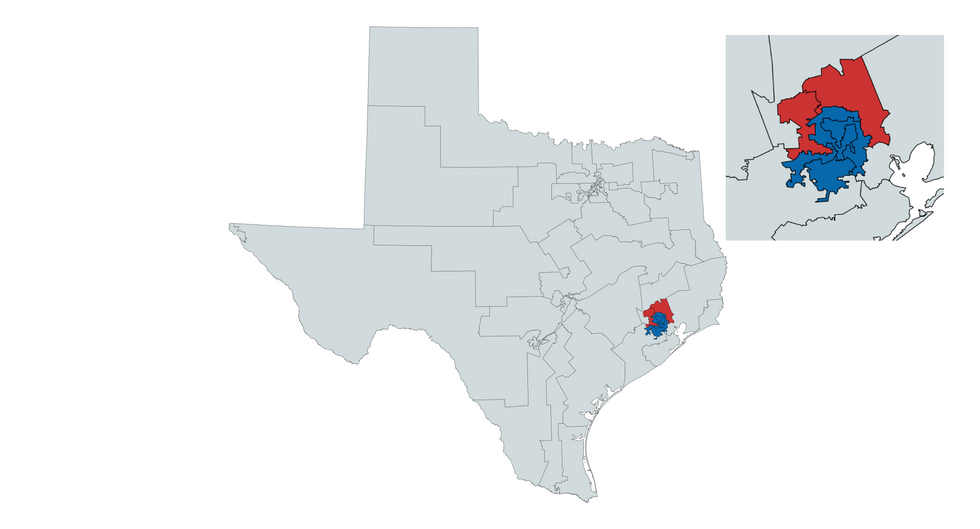
7.Houston
Wang: It is impossible to pick one favorite district in the Houston area, which has expanded in several directions, with burgeoning Asian and Hispanic populations. The partisan redistricting commission has managed to pack heavily Democratic communities into the 7th, 9th, 18th and 29th districts, thus allowing the nearby 2nd and 38th districts to be safely Republican.
Shoucair: Suburban Houston has also experienced a loss of competitiveness, through the splitting of coalitions in the suburbs to ensure that none of the districts drops below 60 percent safe D or R. It's worth noting that the Texas map gives national Republicans a built-in edge when calculating House seats: Democrats win 46 percent to 48 percent of the congressional votes but are able to win only about 34 percent of the congressional seats.
 MapChart
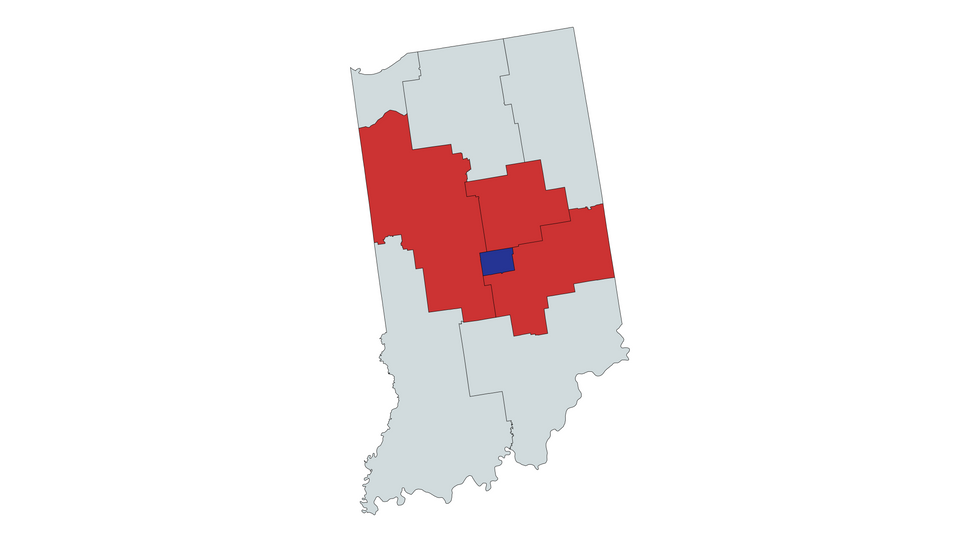
8. Indianapolis
Daley: Republicans sealed a 7-2 edge in Indiana and turned a closely contested seat in Indianapolis into a safe GOP district by packing Democratic pieces of Marion County into the already safe blue 7th district. George Washington University political scientist Chris Warshaw called the map "one of the most extreme gerrymanders in history."
 MapChart
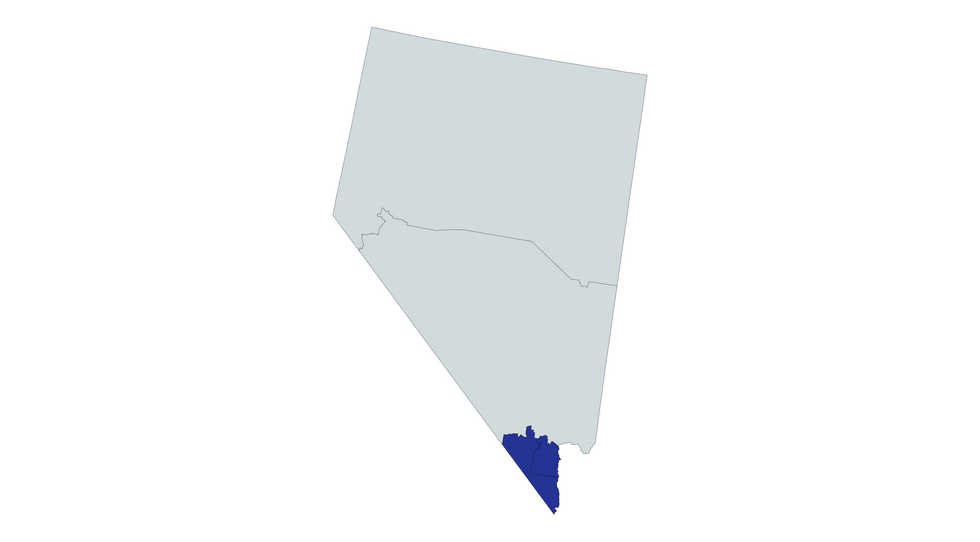
9. Las Vegas
Wang: Nevada Democrats used highways as artificial boundaries to distribute Hispanic voters between two districts, giving them partisan influence but removing their ability to vote as a unified group. The northern boundary of Nevada’s 1st district goes right through heavily Hispanic areas of greater Las Vegas.
 MapChart
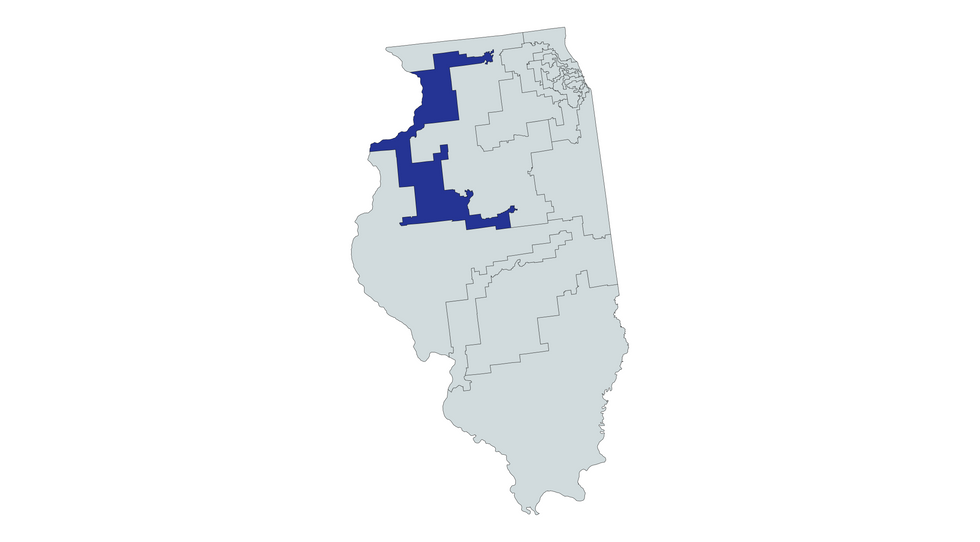
10. Snaking through northern Illinois
Gaber: The noncompact 17th district starts in Springfield, wraps around the western border to pick up Moline, before stretching to the northeast to grab Rockford, in order to create an unnaturally configured Democratic district.
 MapChart
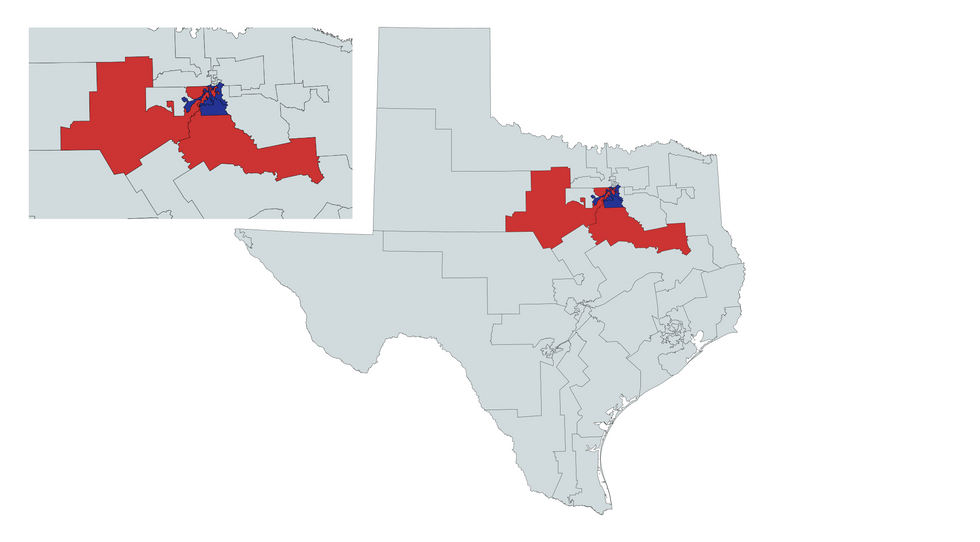
11. Dallas
Shoucair: The shape of the 6th, 24th, 25th, 30th, 32nd and 33rd districts reduces the competitiveness of the congressional elections around the Dallas suburbs. This has been accomplished by packing Democratic-leaning votes into three districts and neutralizing other Democratic-leaning areas by drawing them into the more conservative areas of the panhandle.
 MapChart
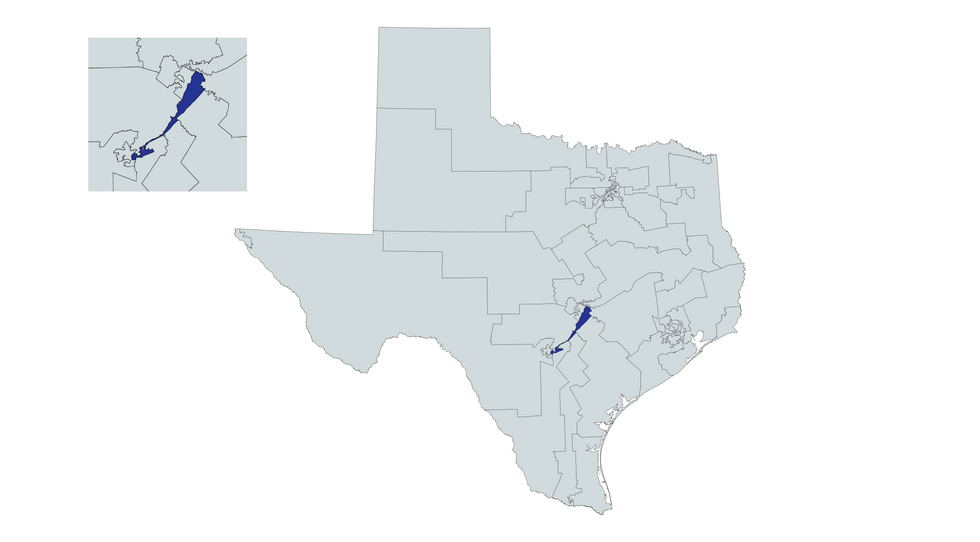
12. San Antonio to Austin
Seabrook: Texas 35th district stretches from San Antonio, incorporating large parts of the city’s south and east side, all the way to Austin, 100 miles away, snaking along and in some cases not much wider than Interstate 35 highway. It was drawn to pack Democratic voters and cement the GOP gains in Texas’s U.S. House delegation, which they control, 25-13.
Dishonorable mention
Oklahoma City; Portland, Oregon; Raleigh, North Carolina, and the entire maps in Alabama and Arizona.
Meyers is executive editor of The Fulcrum.